

Tue, Apr 7
+$302
NQ Short+$120
Opening range · 09:50 to 10:03 · Funded
“Took the planned target.”
QQQ Long+$182
VWAP reclaim · 10:05 to 12:20 · Main
“Waited for the reclaim. Exited before my planned target.”
7 days free3 indicators and the journal
Three indicators on your TradingView chart. One journal for every trade after.
Hand-picked support and resistance on 55 symbols, updated weekly.
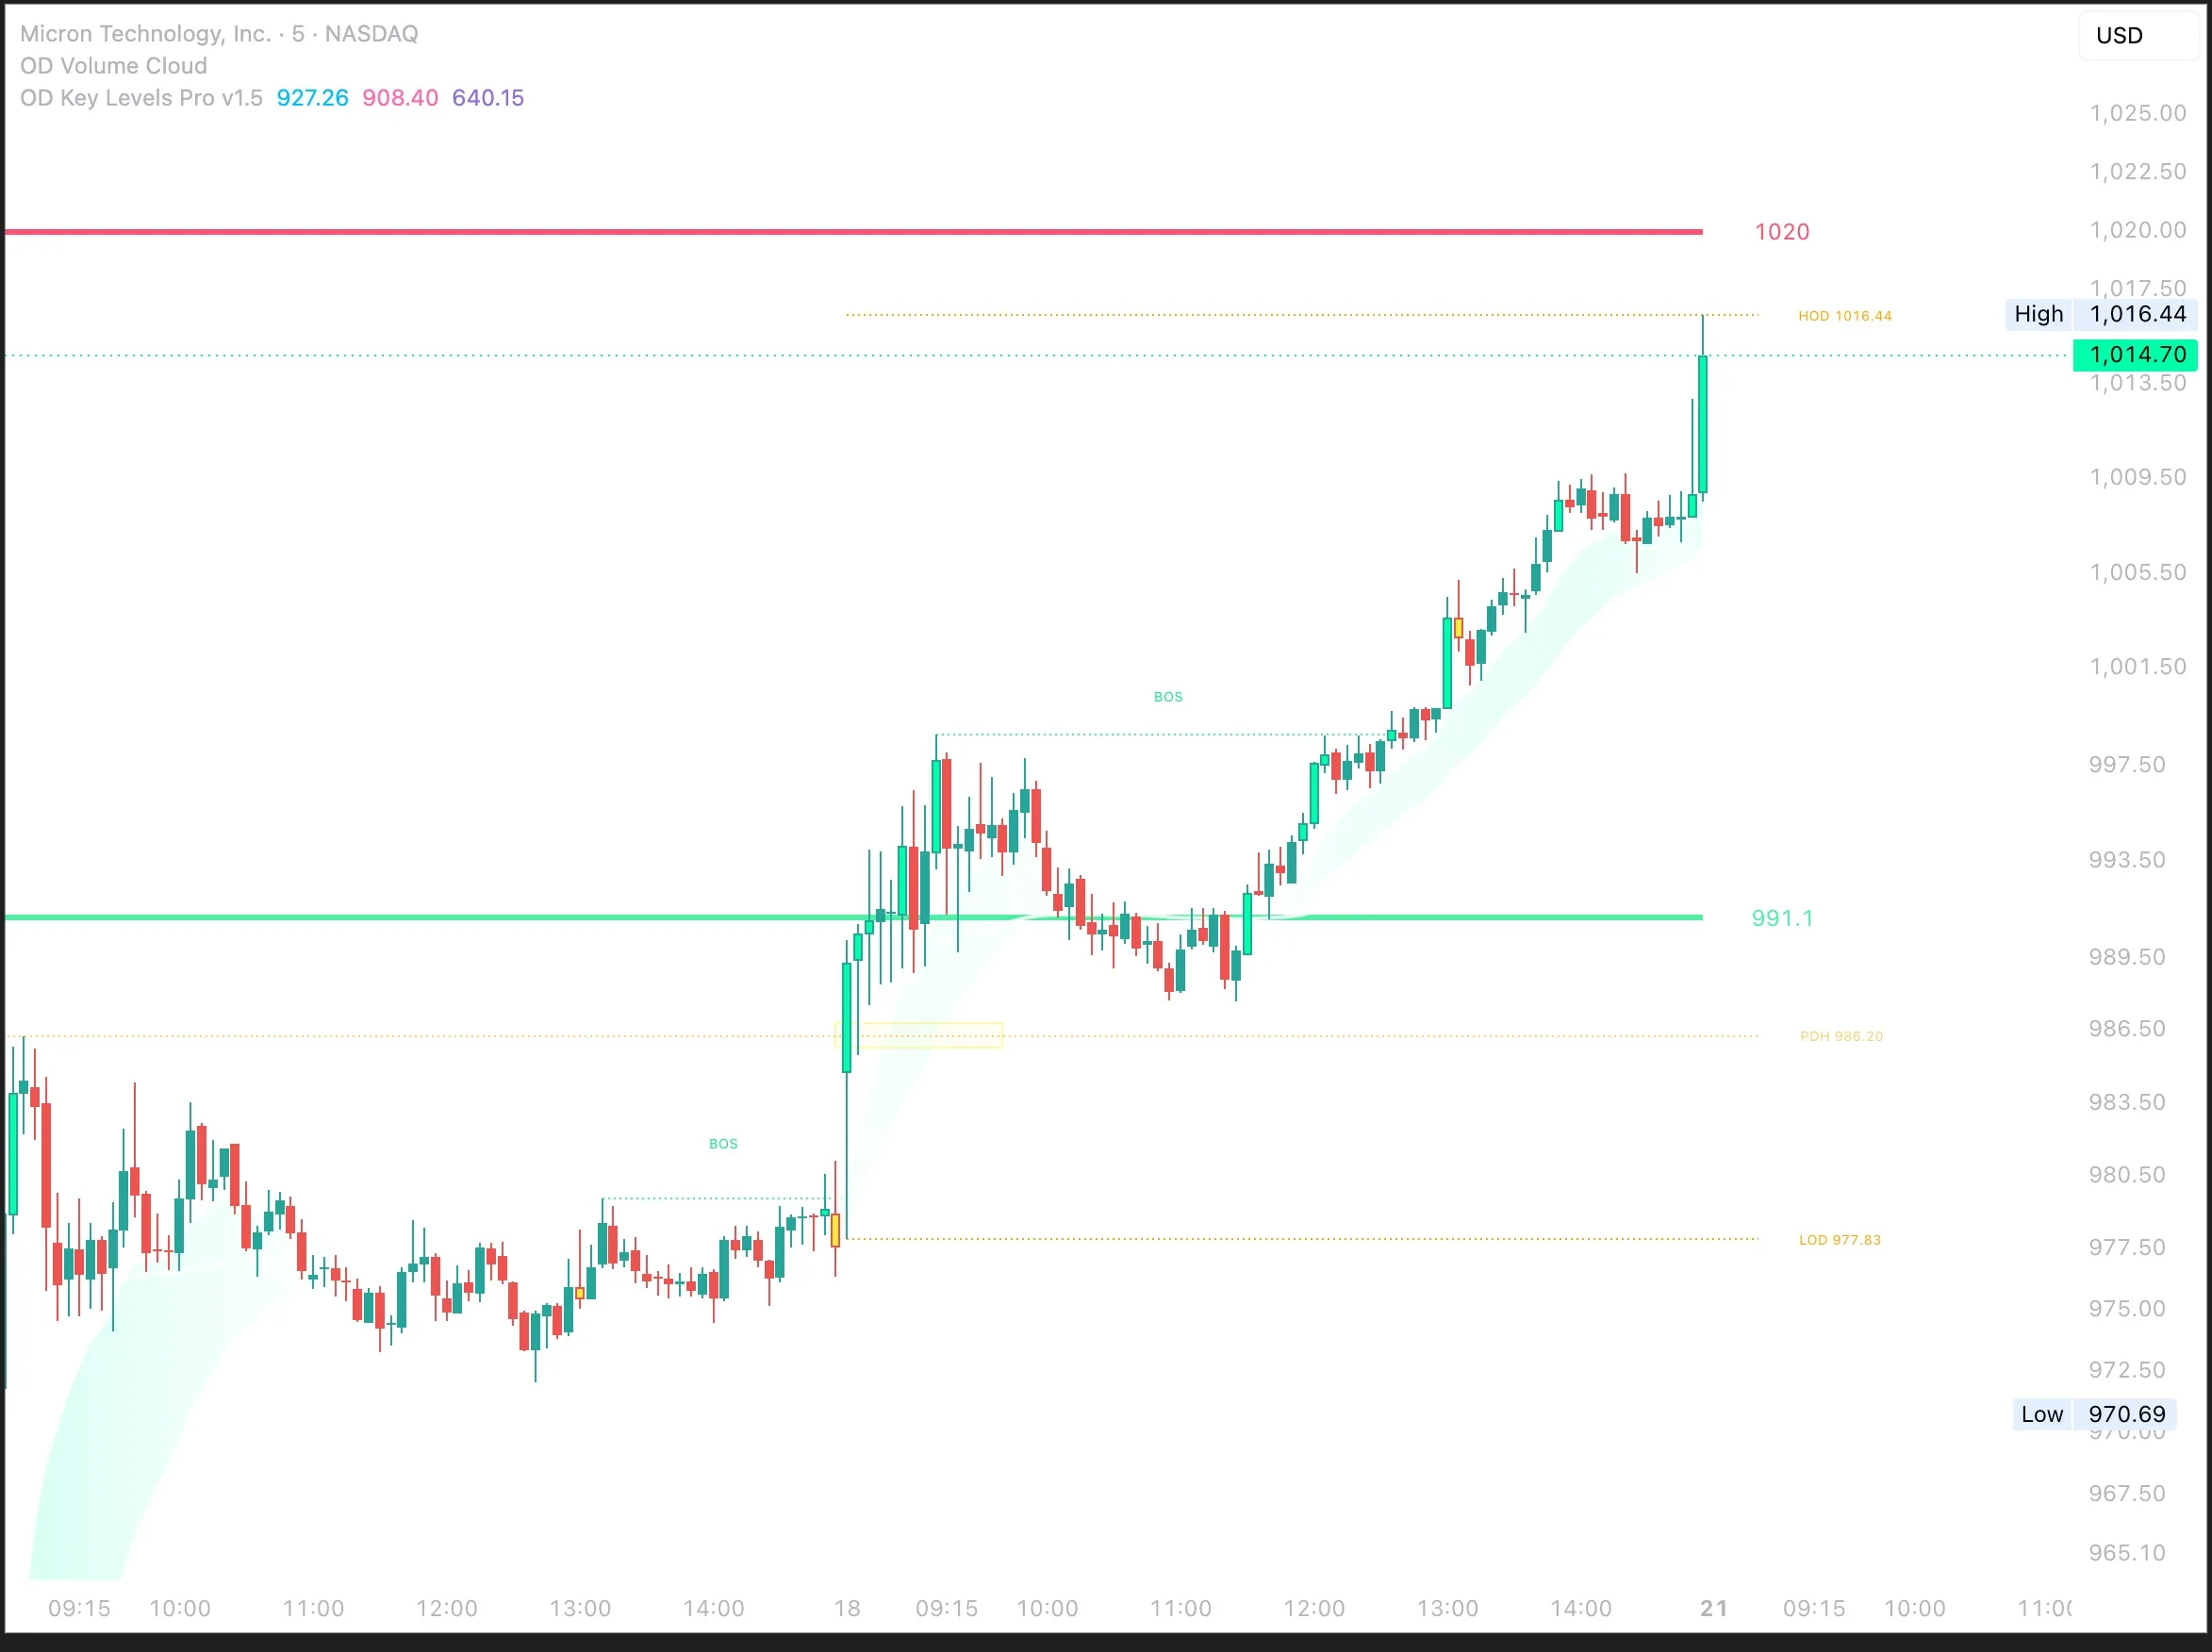
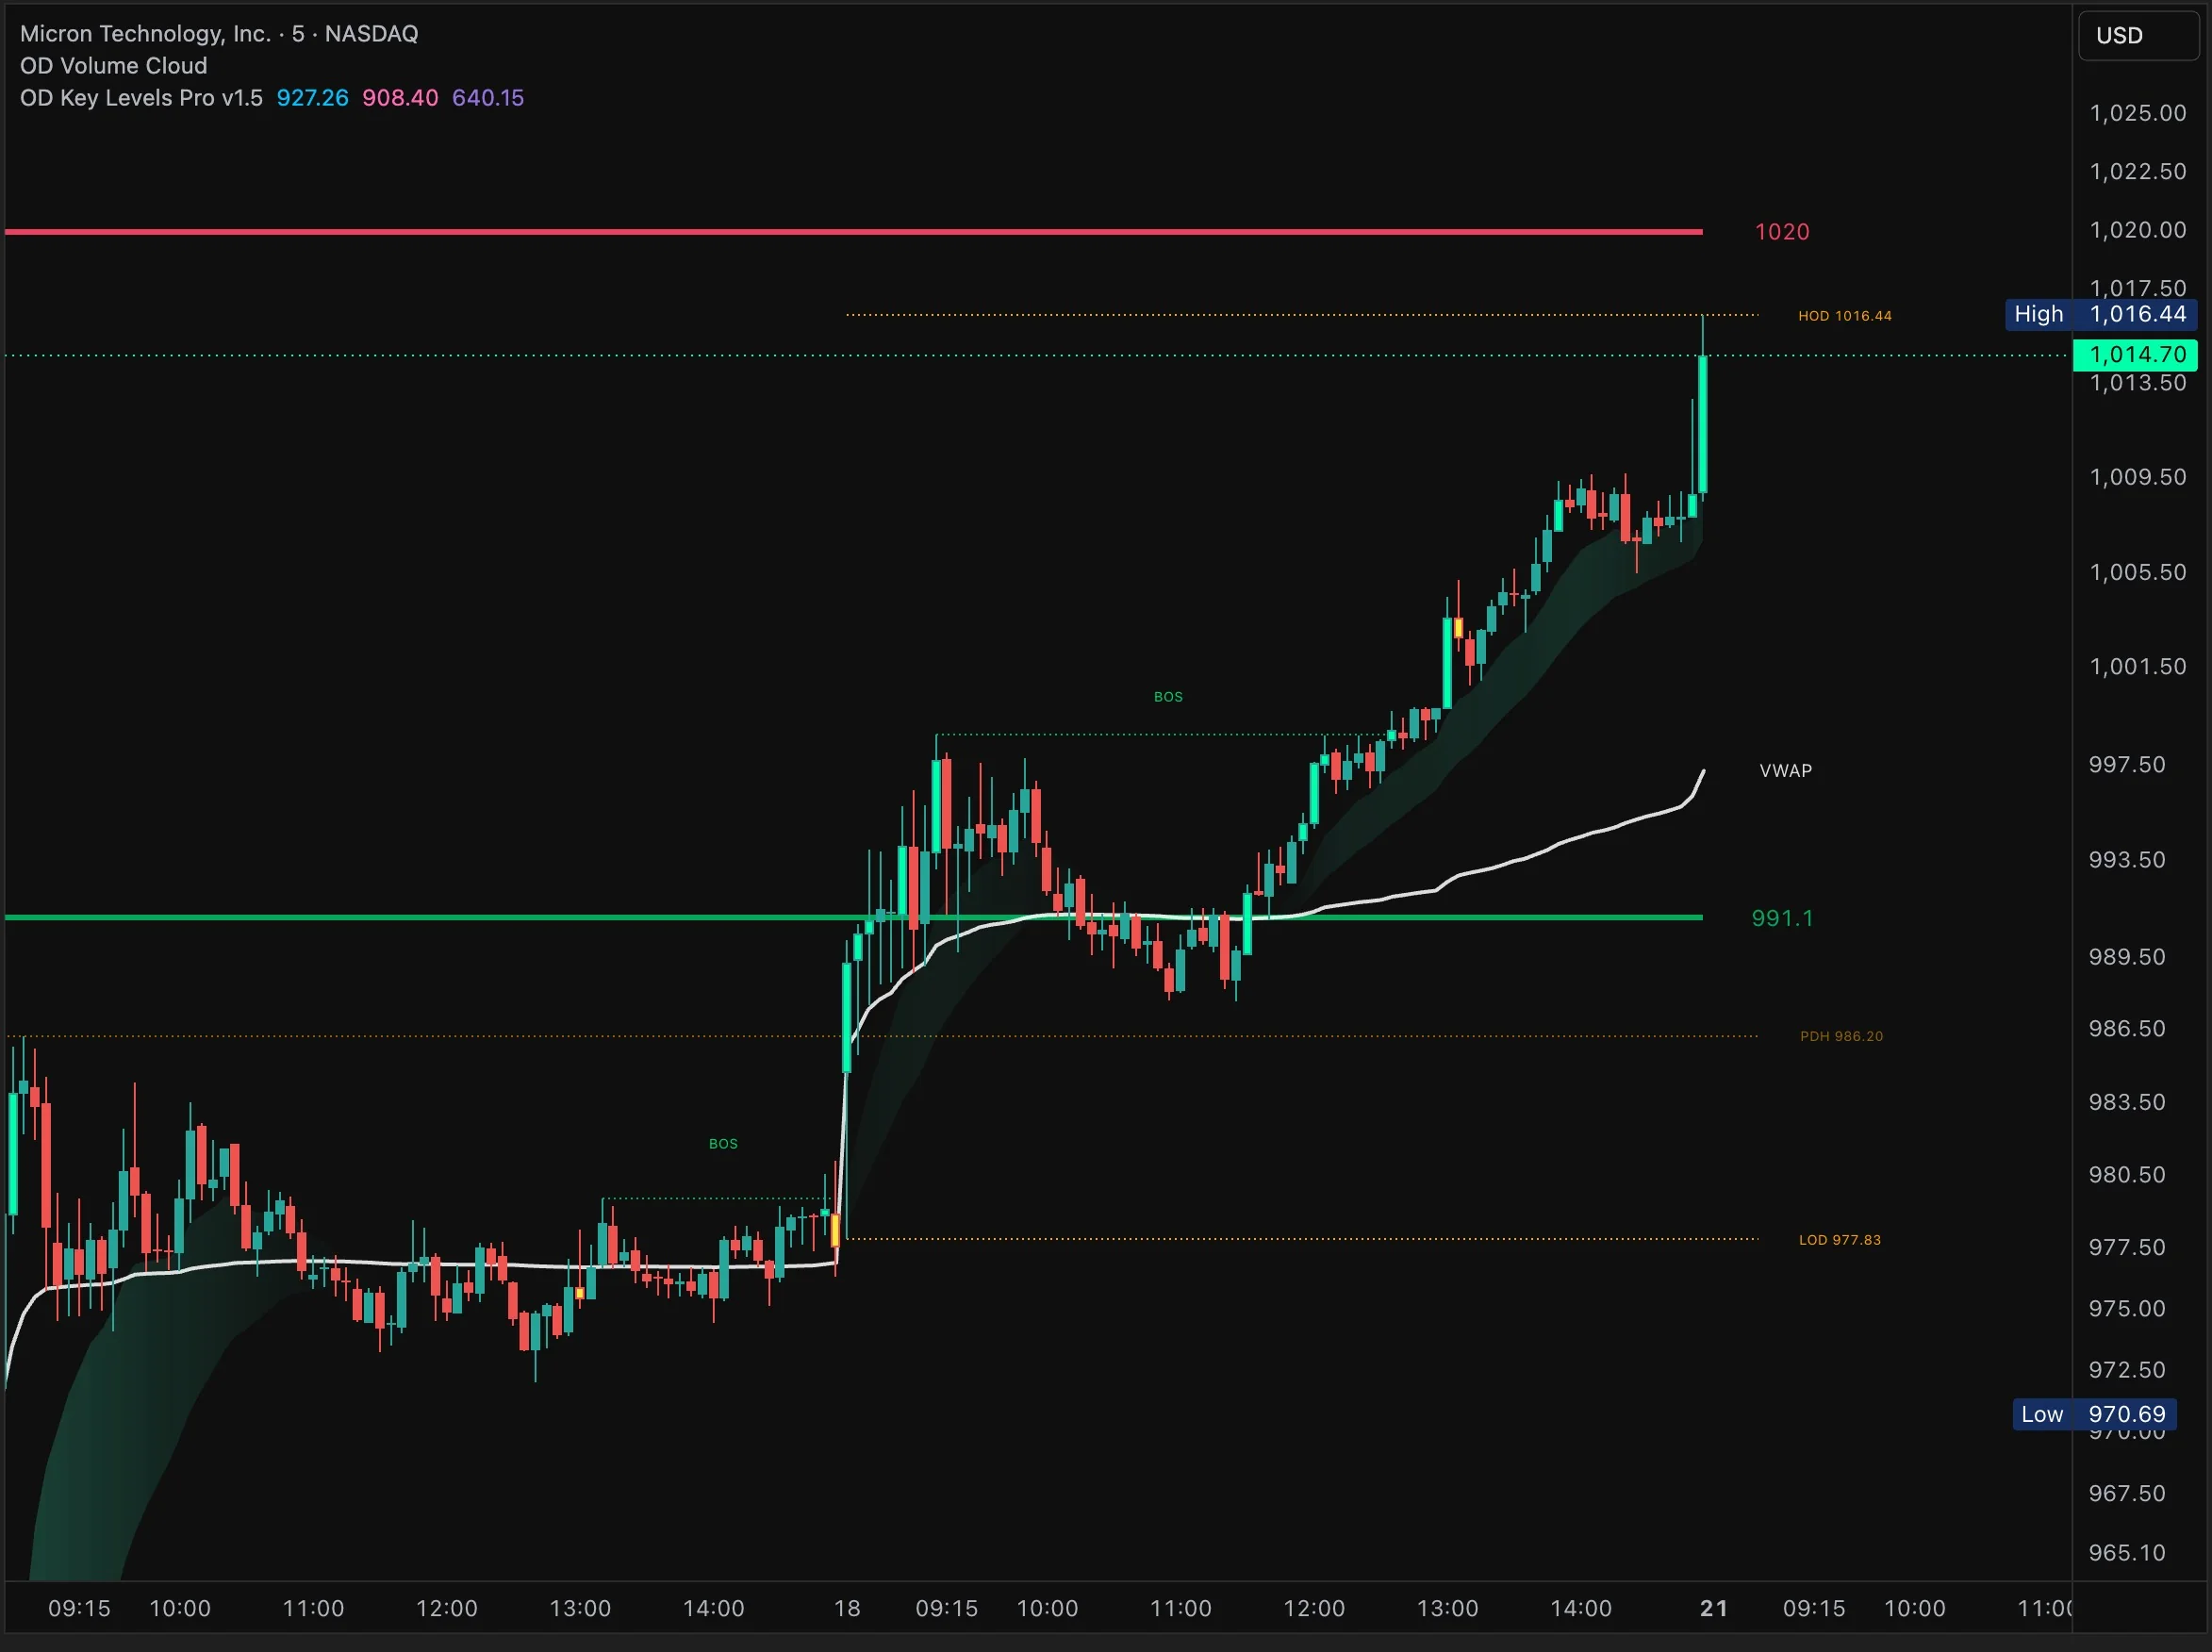
 Buy/Sell Volume
Free for 7 days, then $30/month · Cancel anytime
Before and after
Drag the handle.
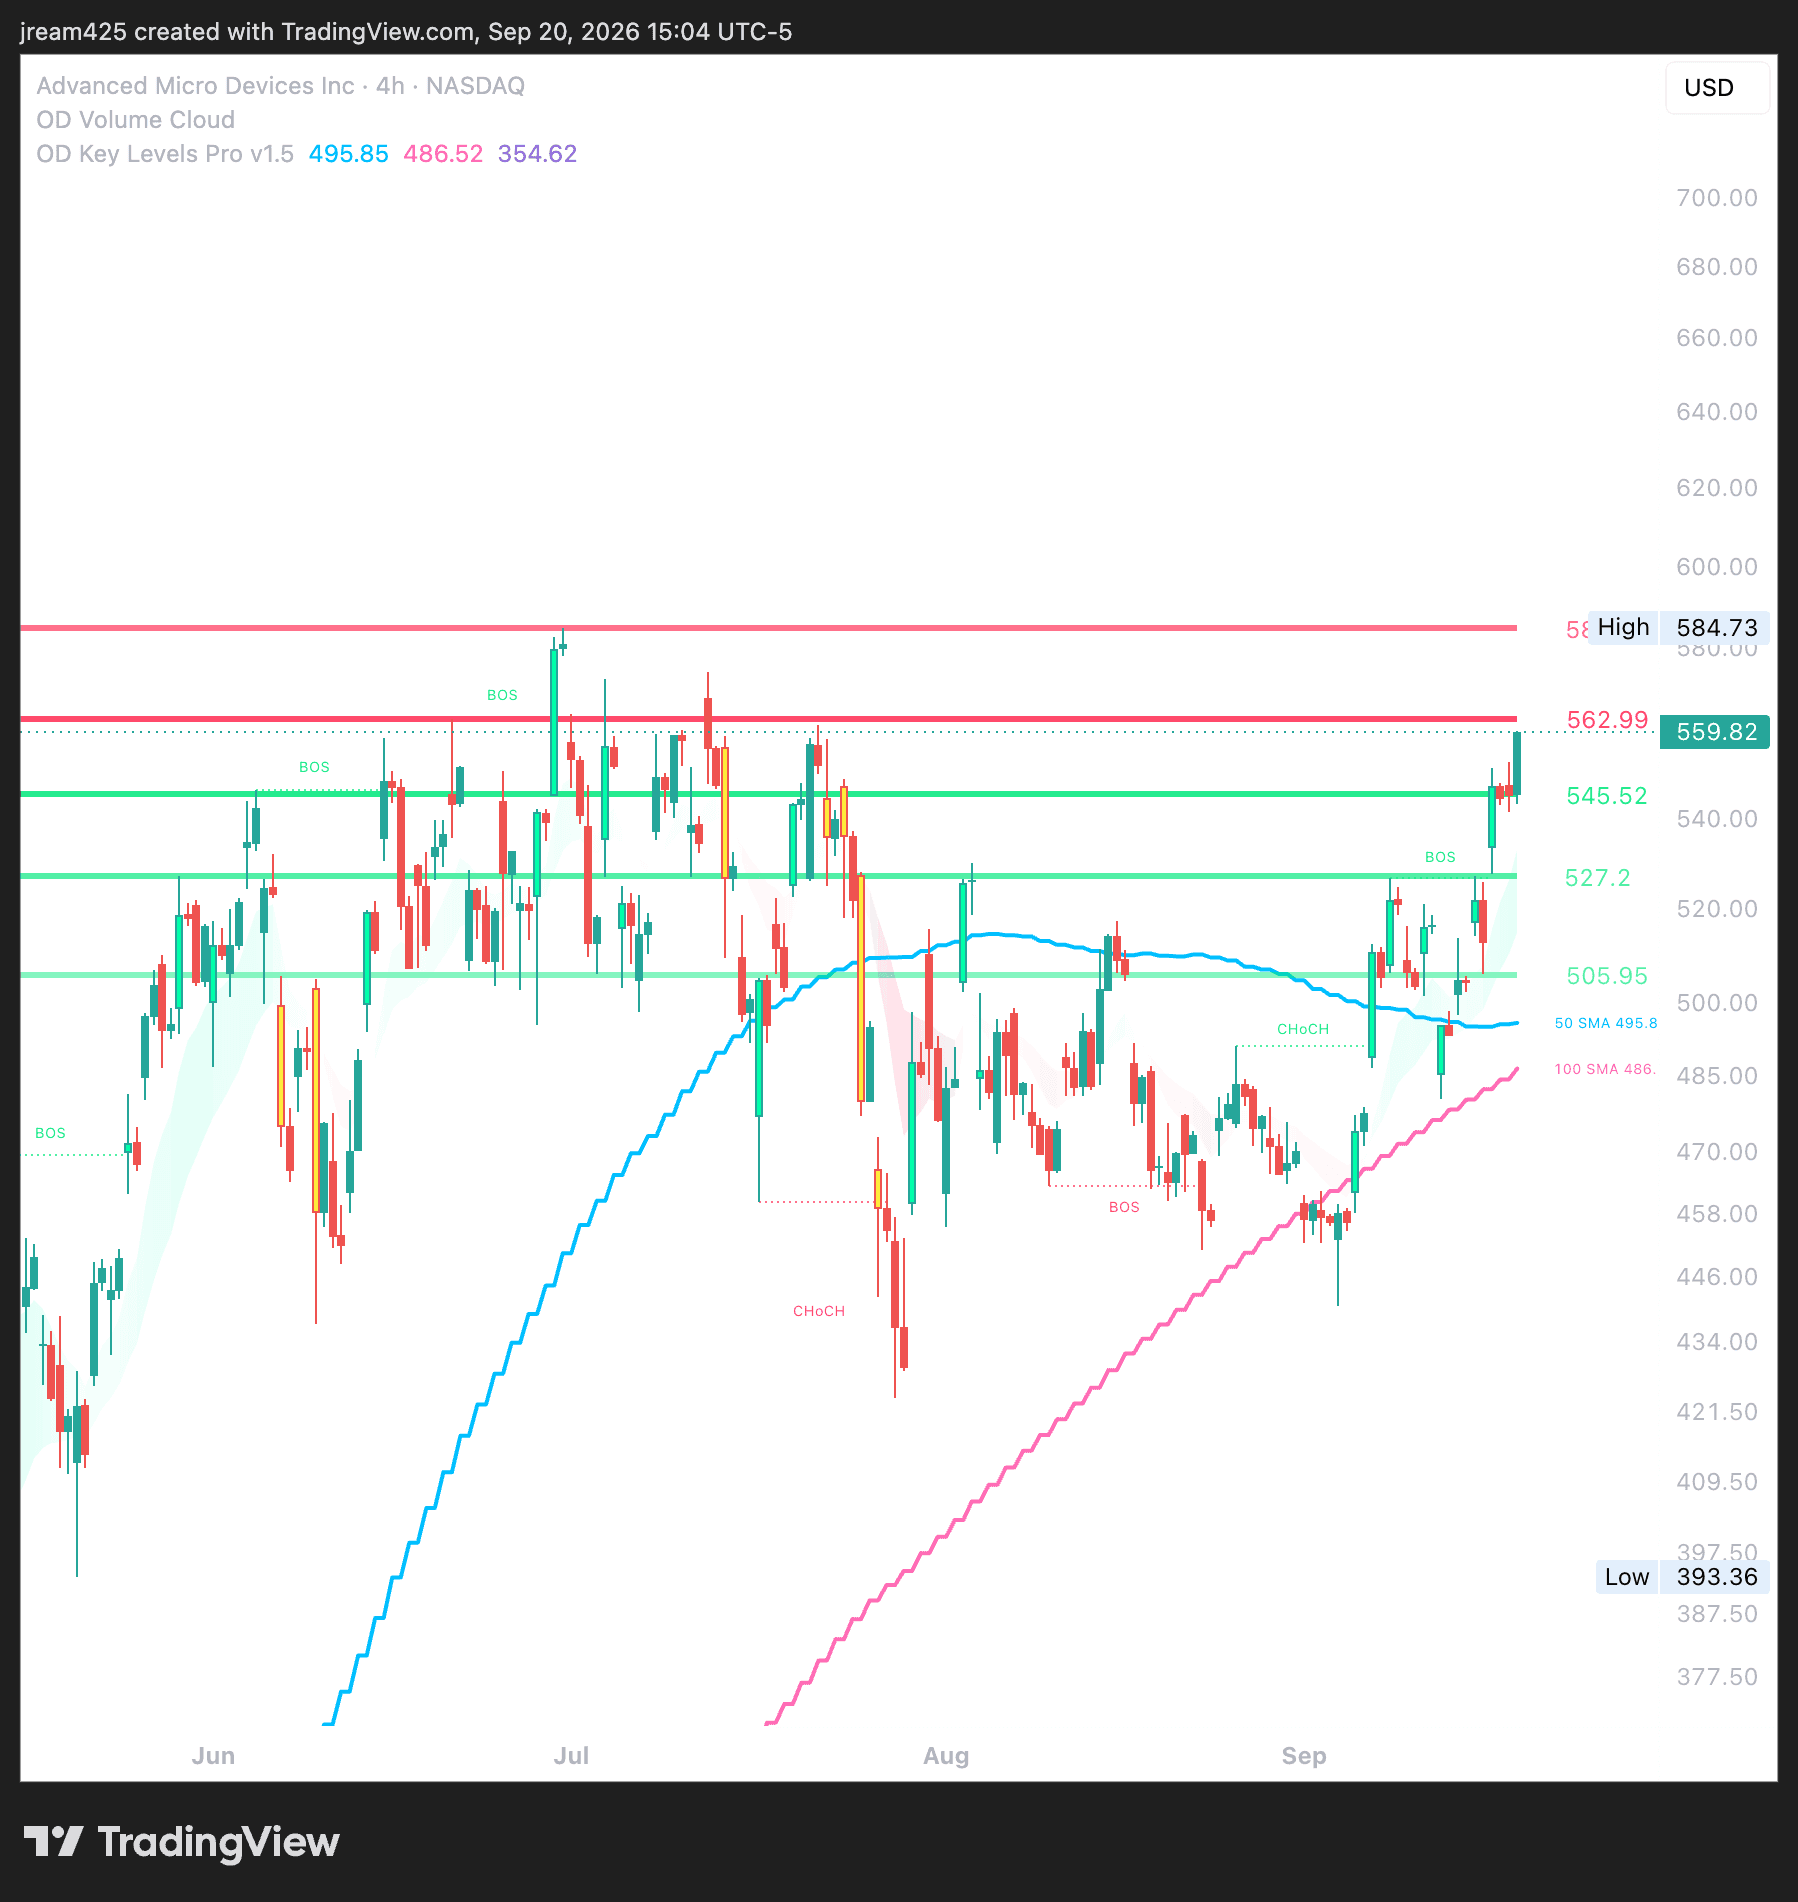
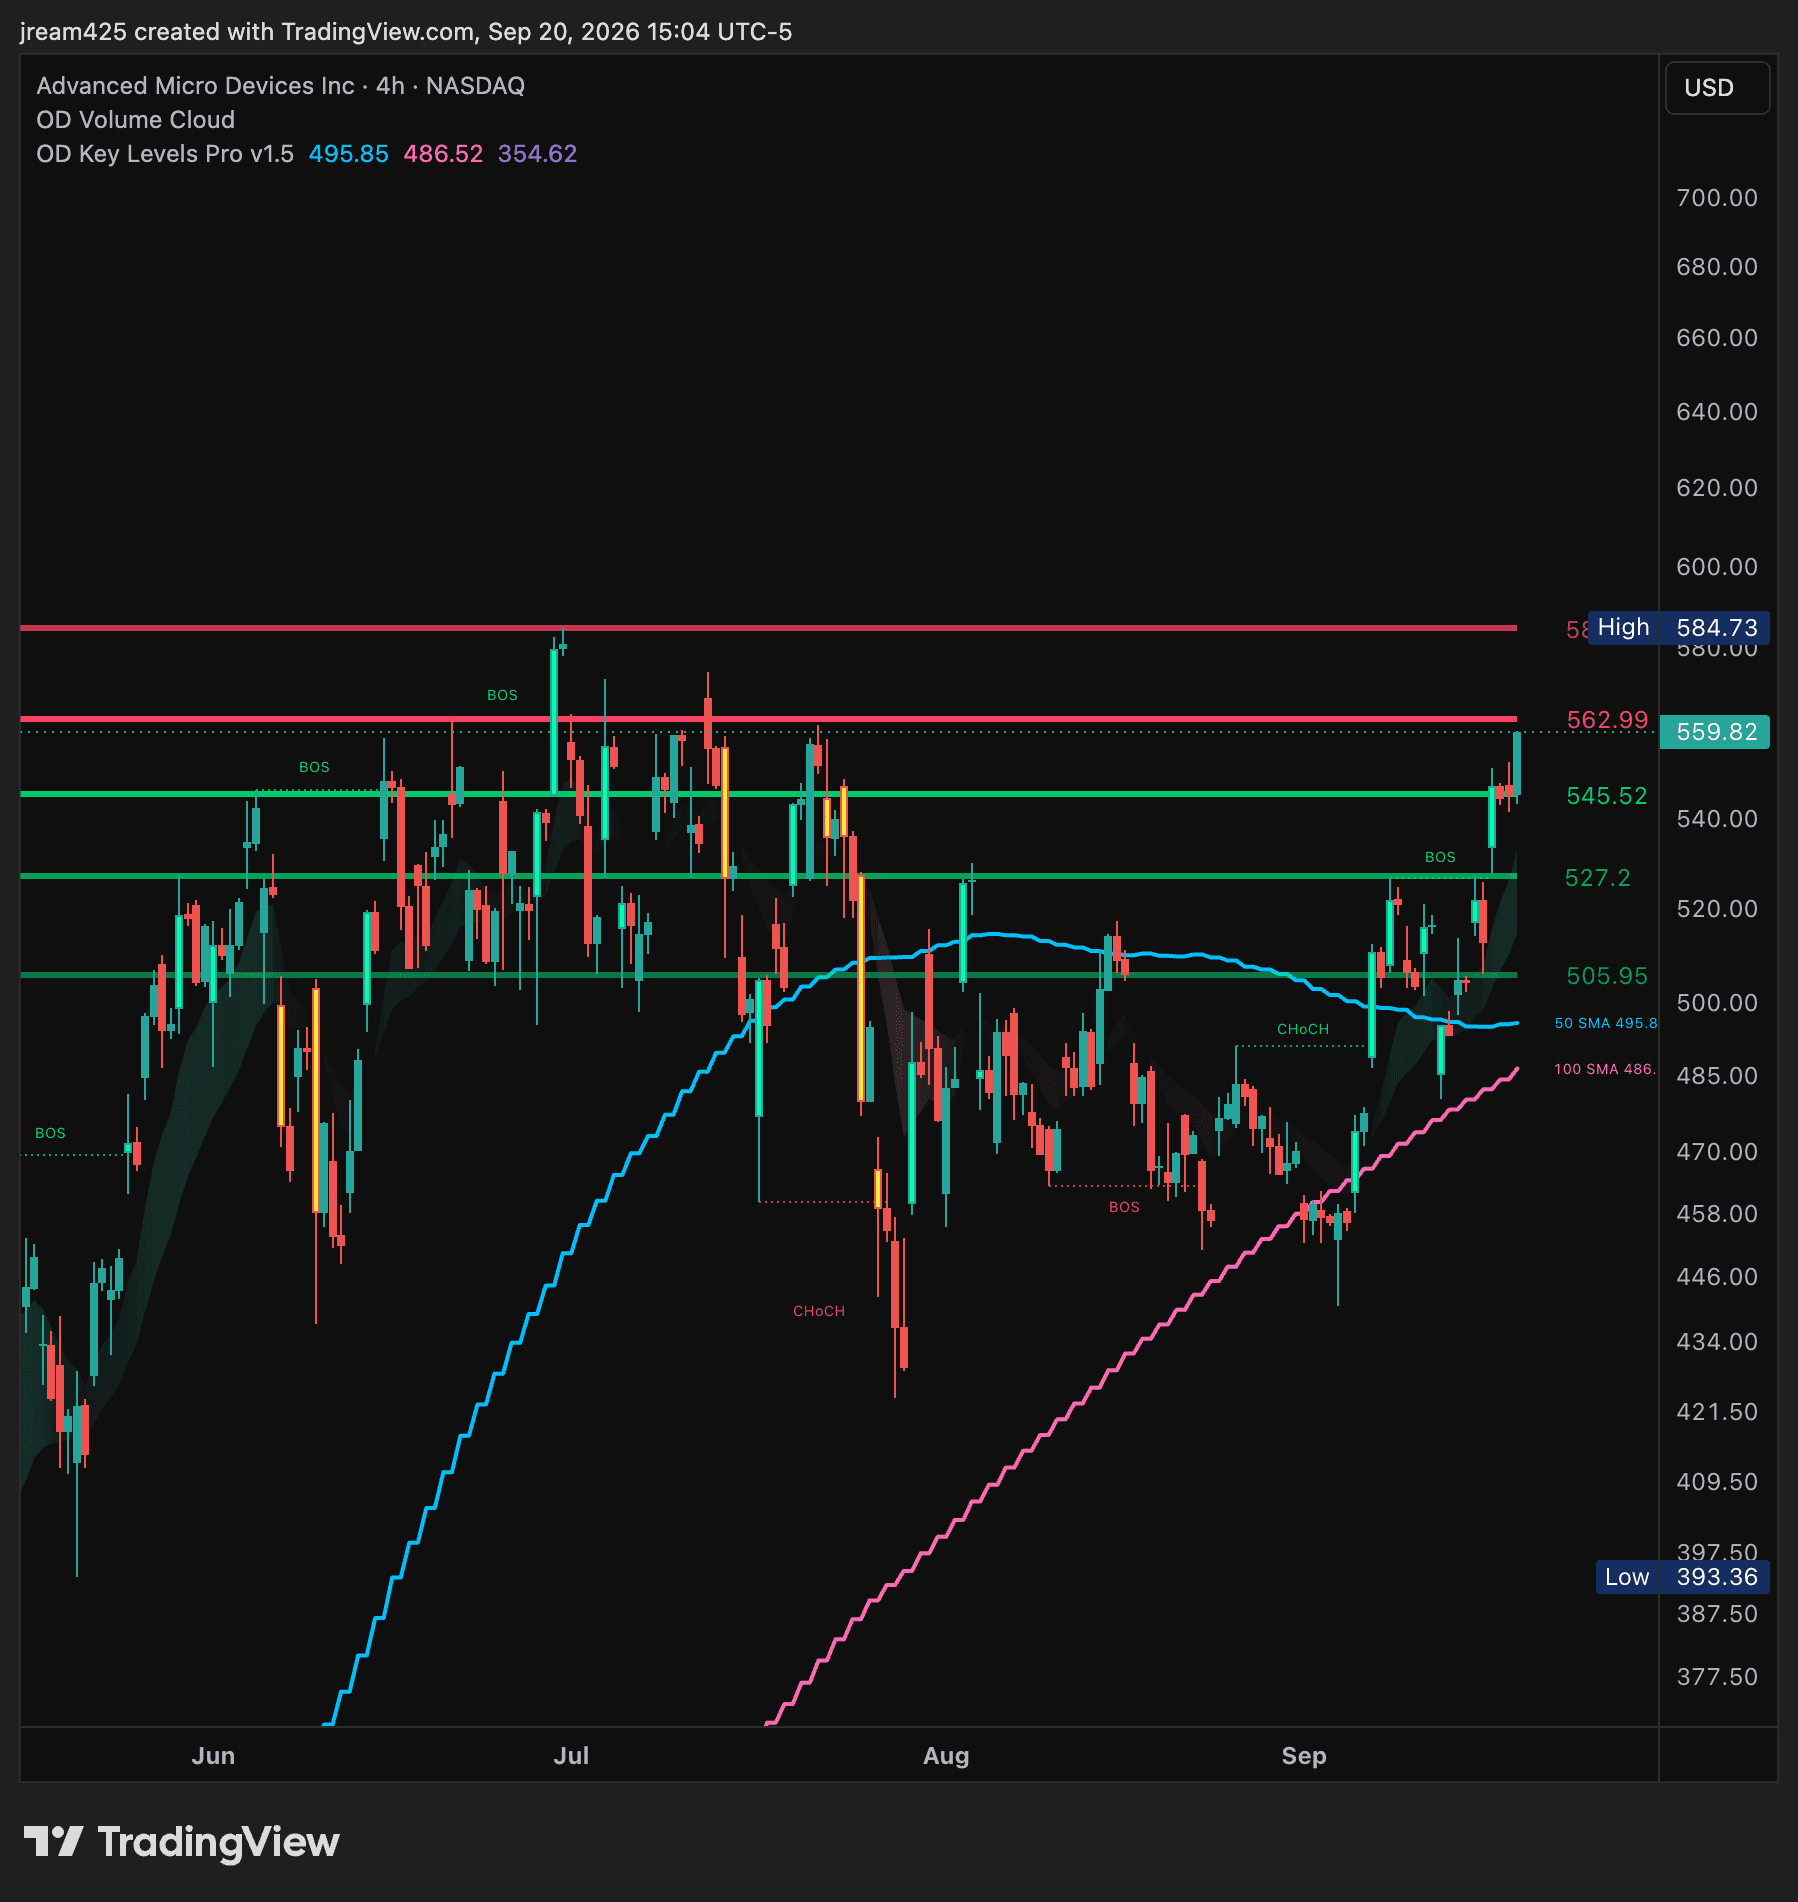
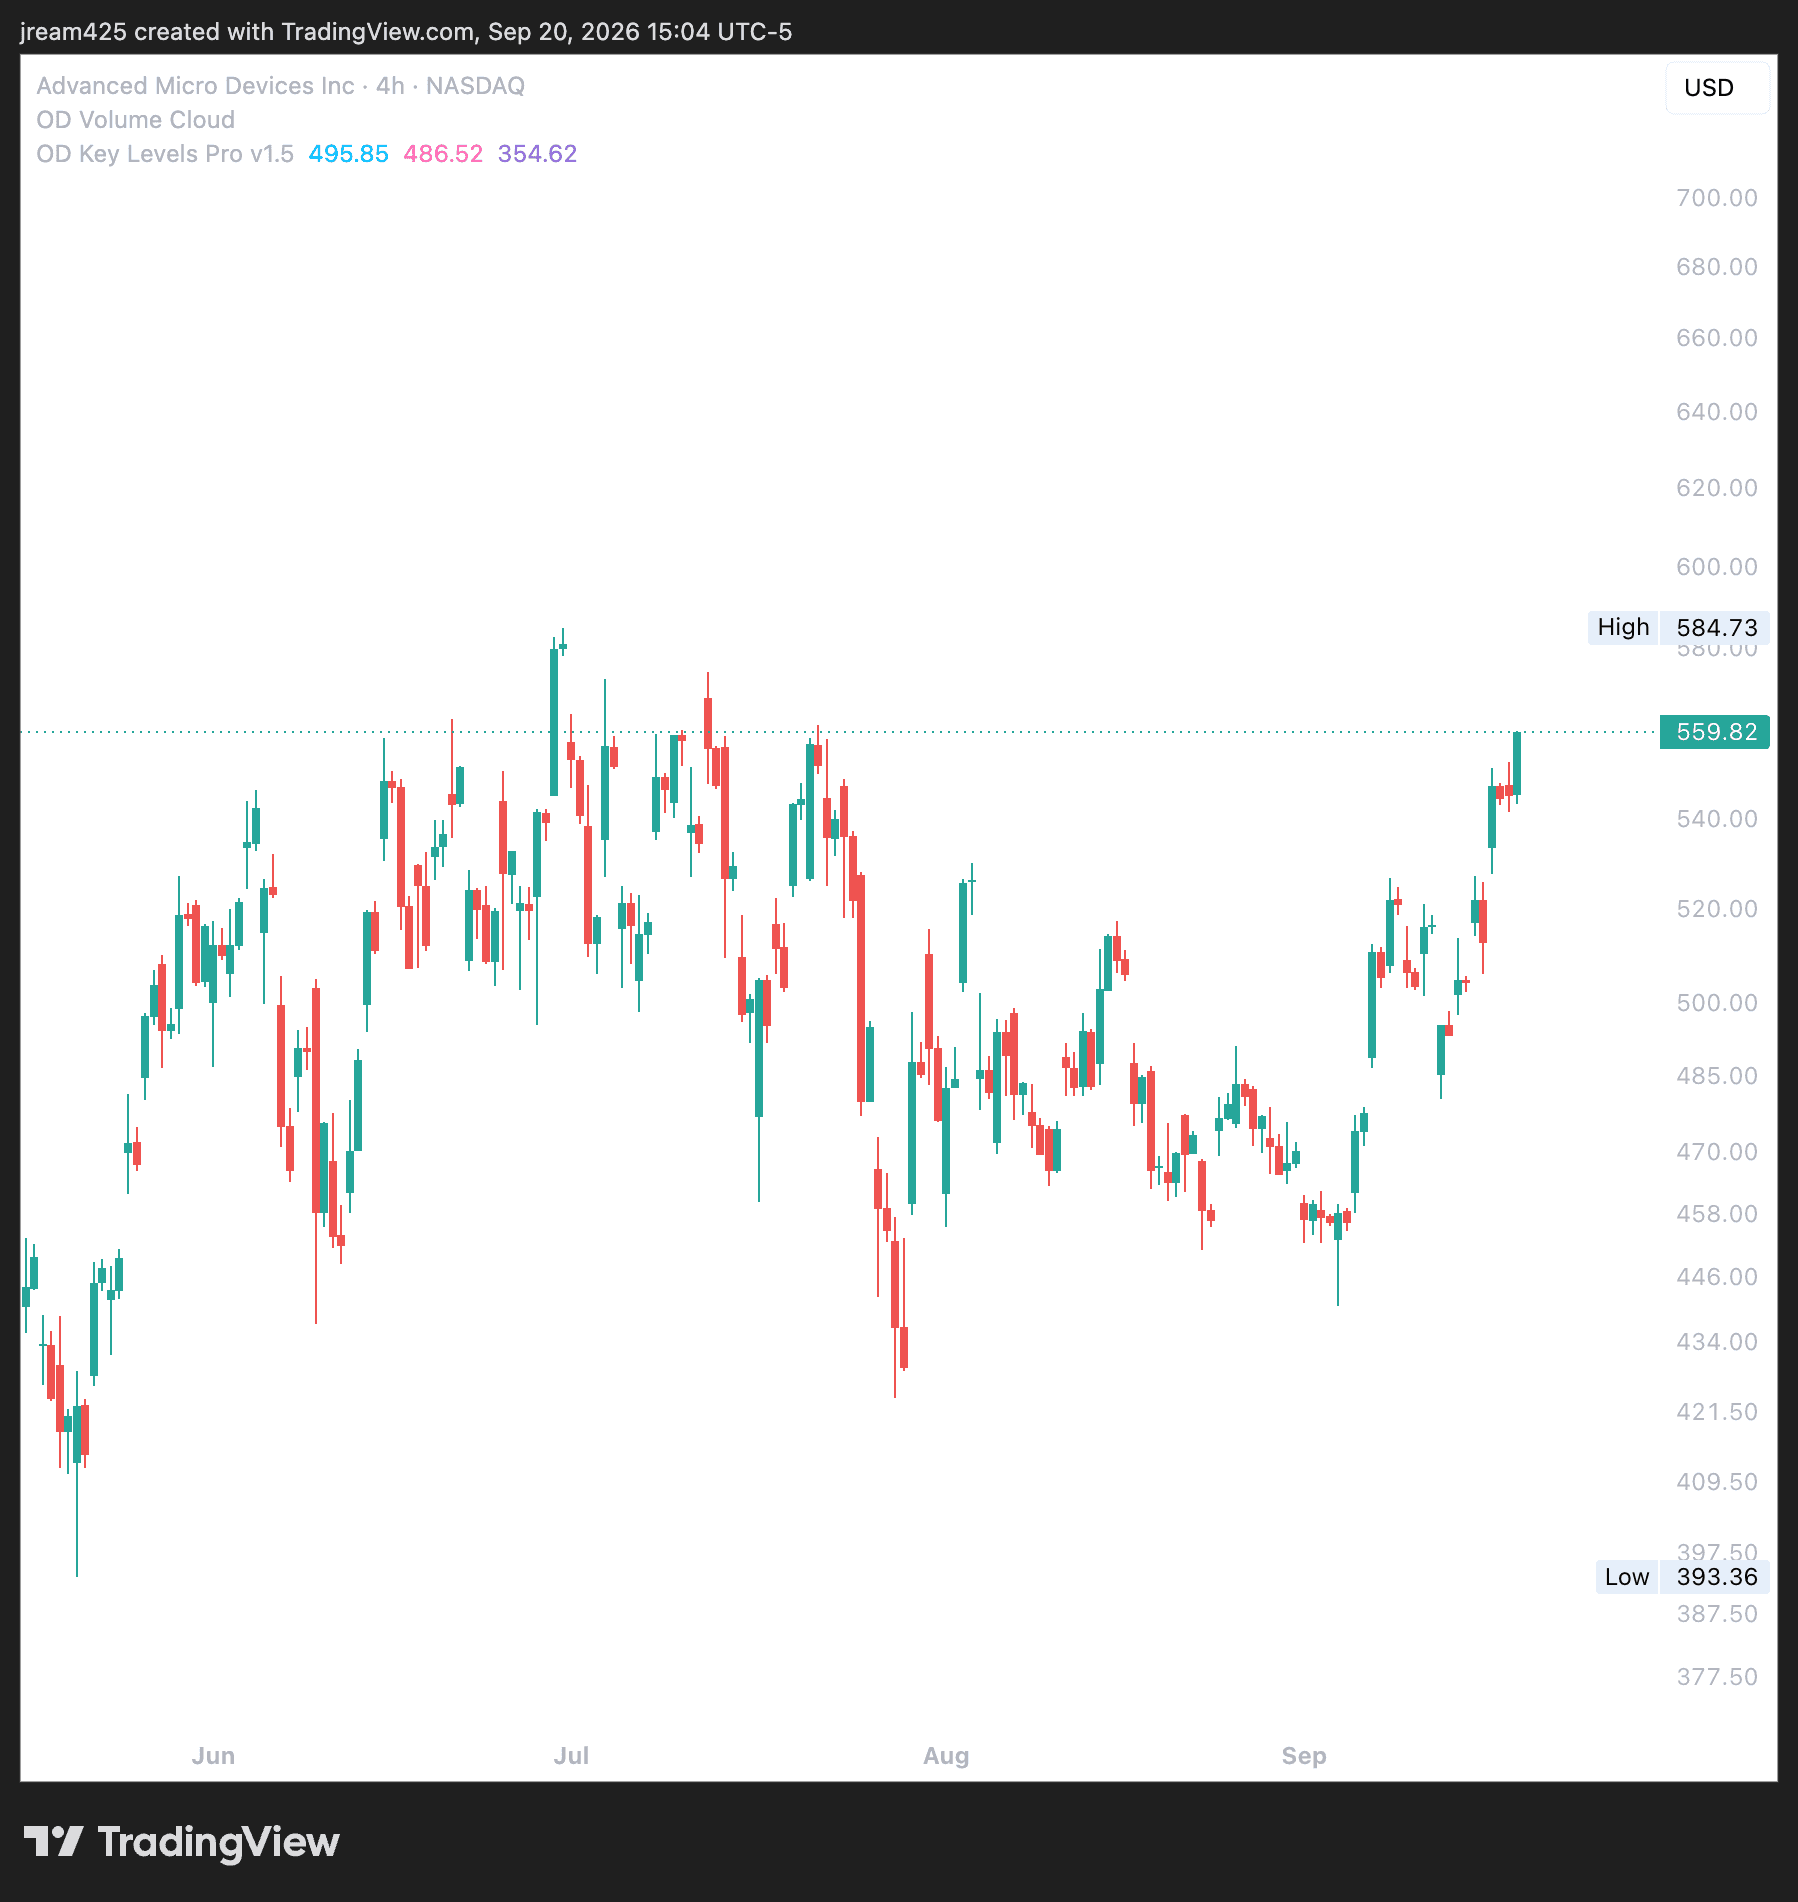
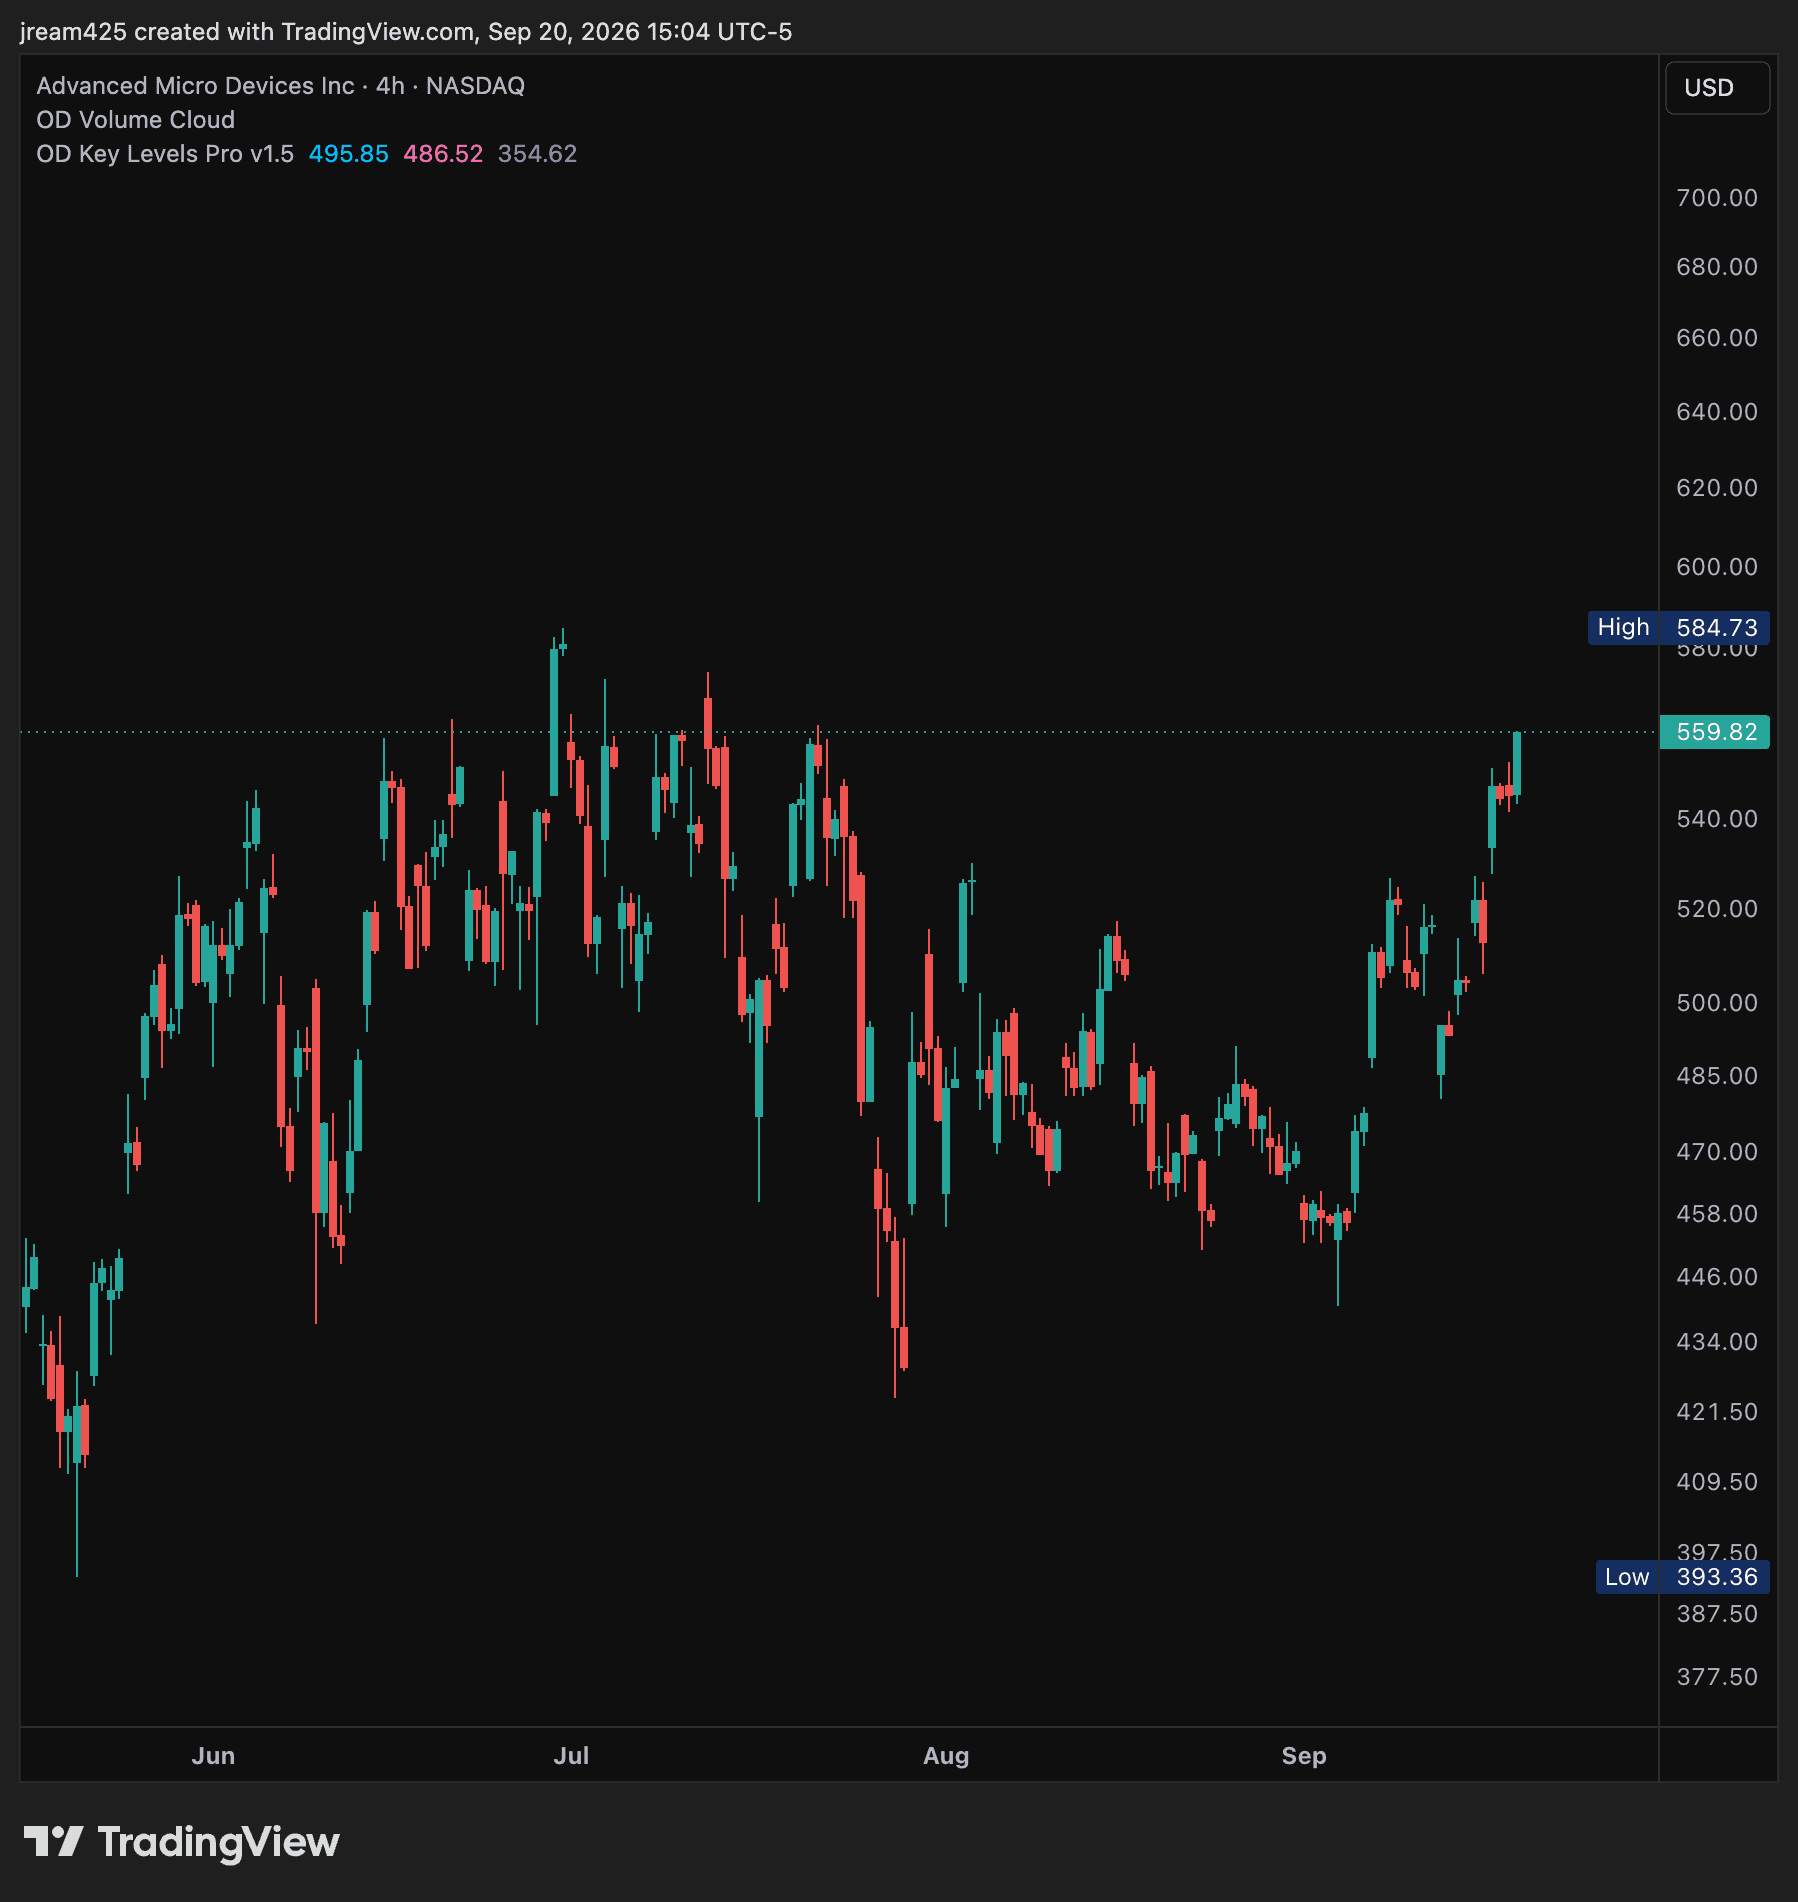
Drag the handle left or right. Use arrow keys, Home or End, to adjust the comparison. The annotated example highlights resistance at 562.99, support at 505.95 and a break of structure.
AMD · Four-hour snapshots
Before the trade
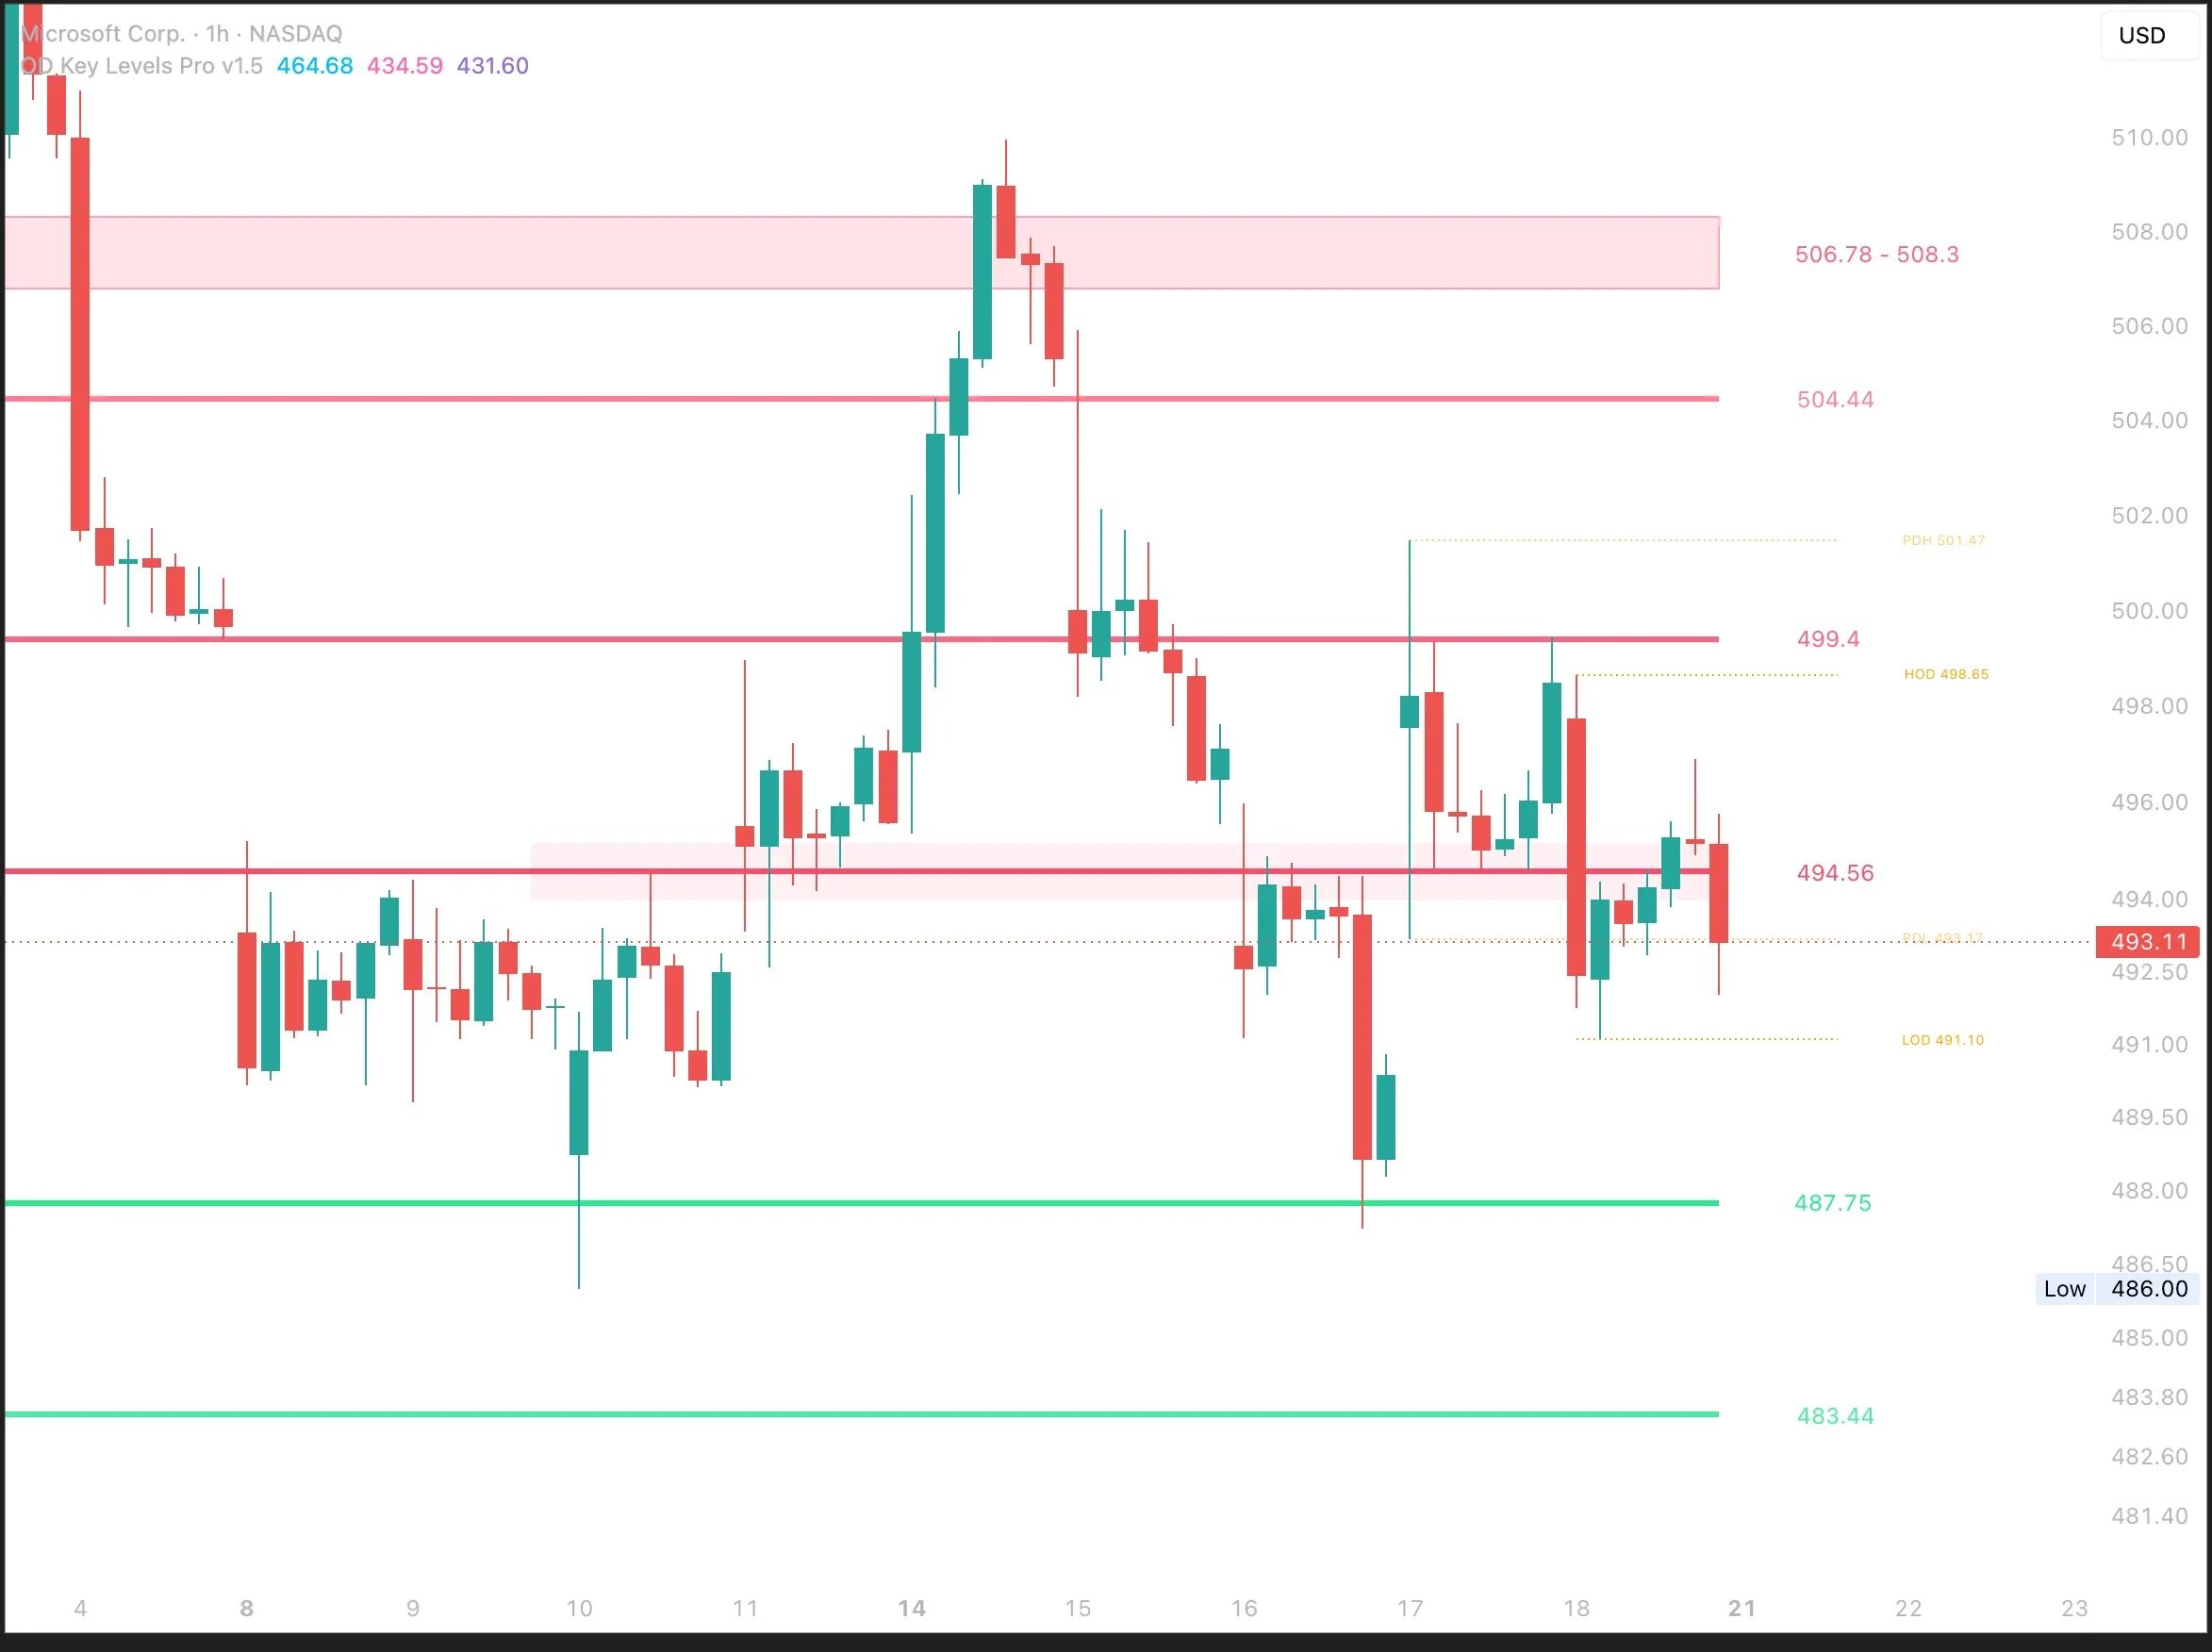
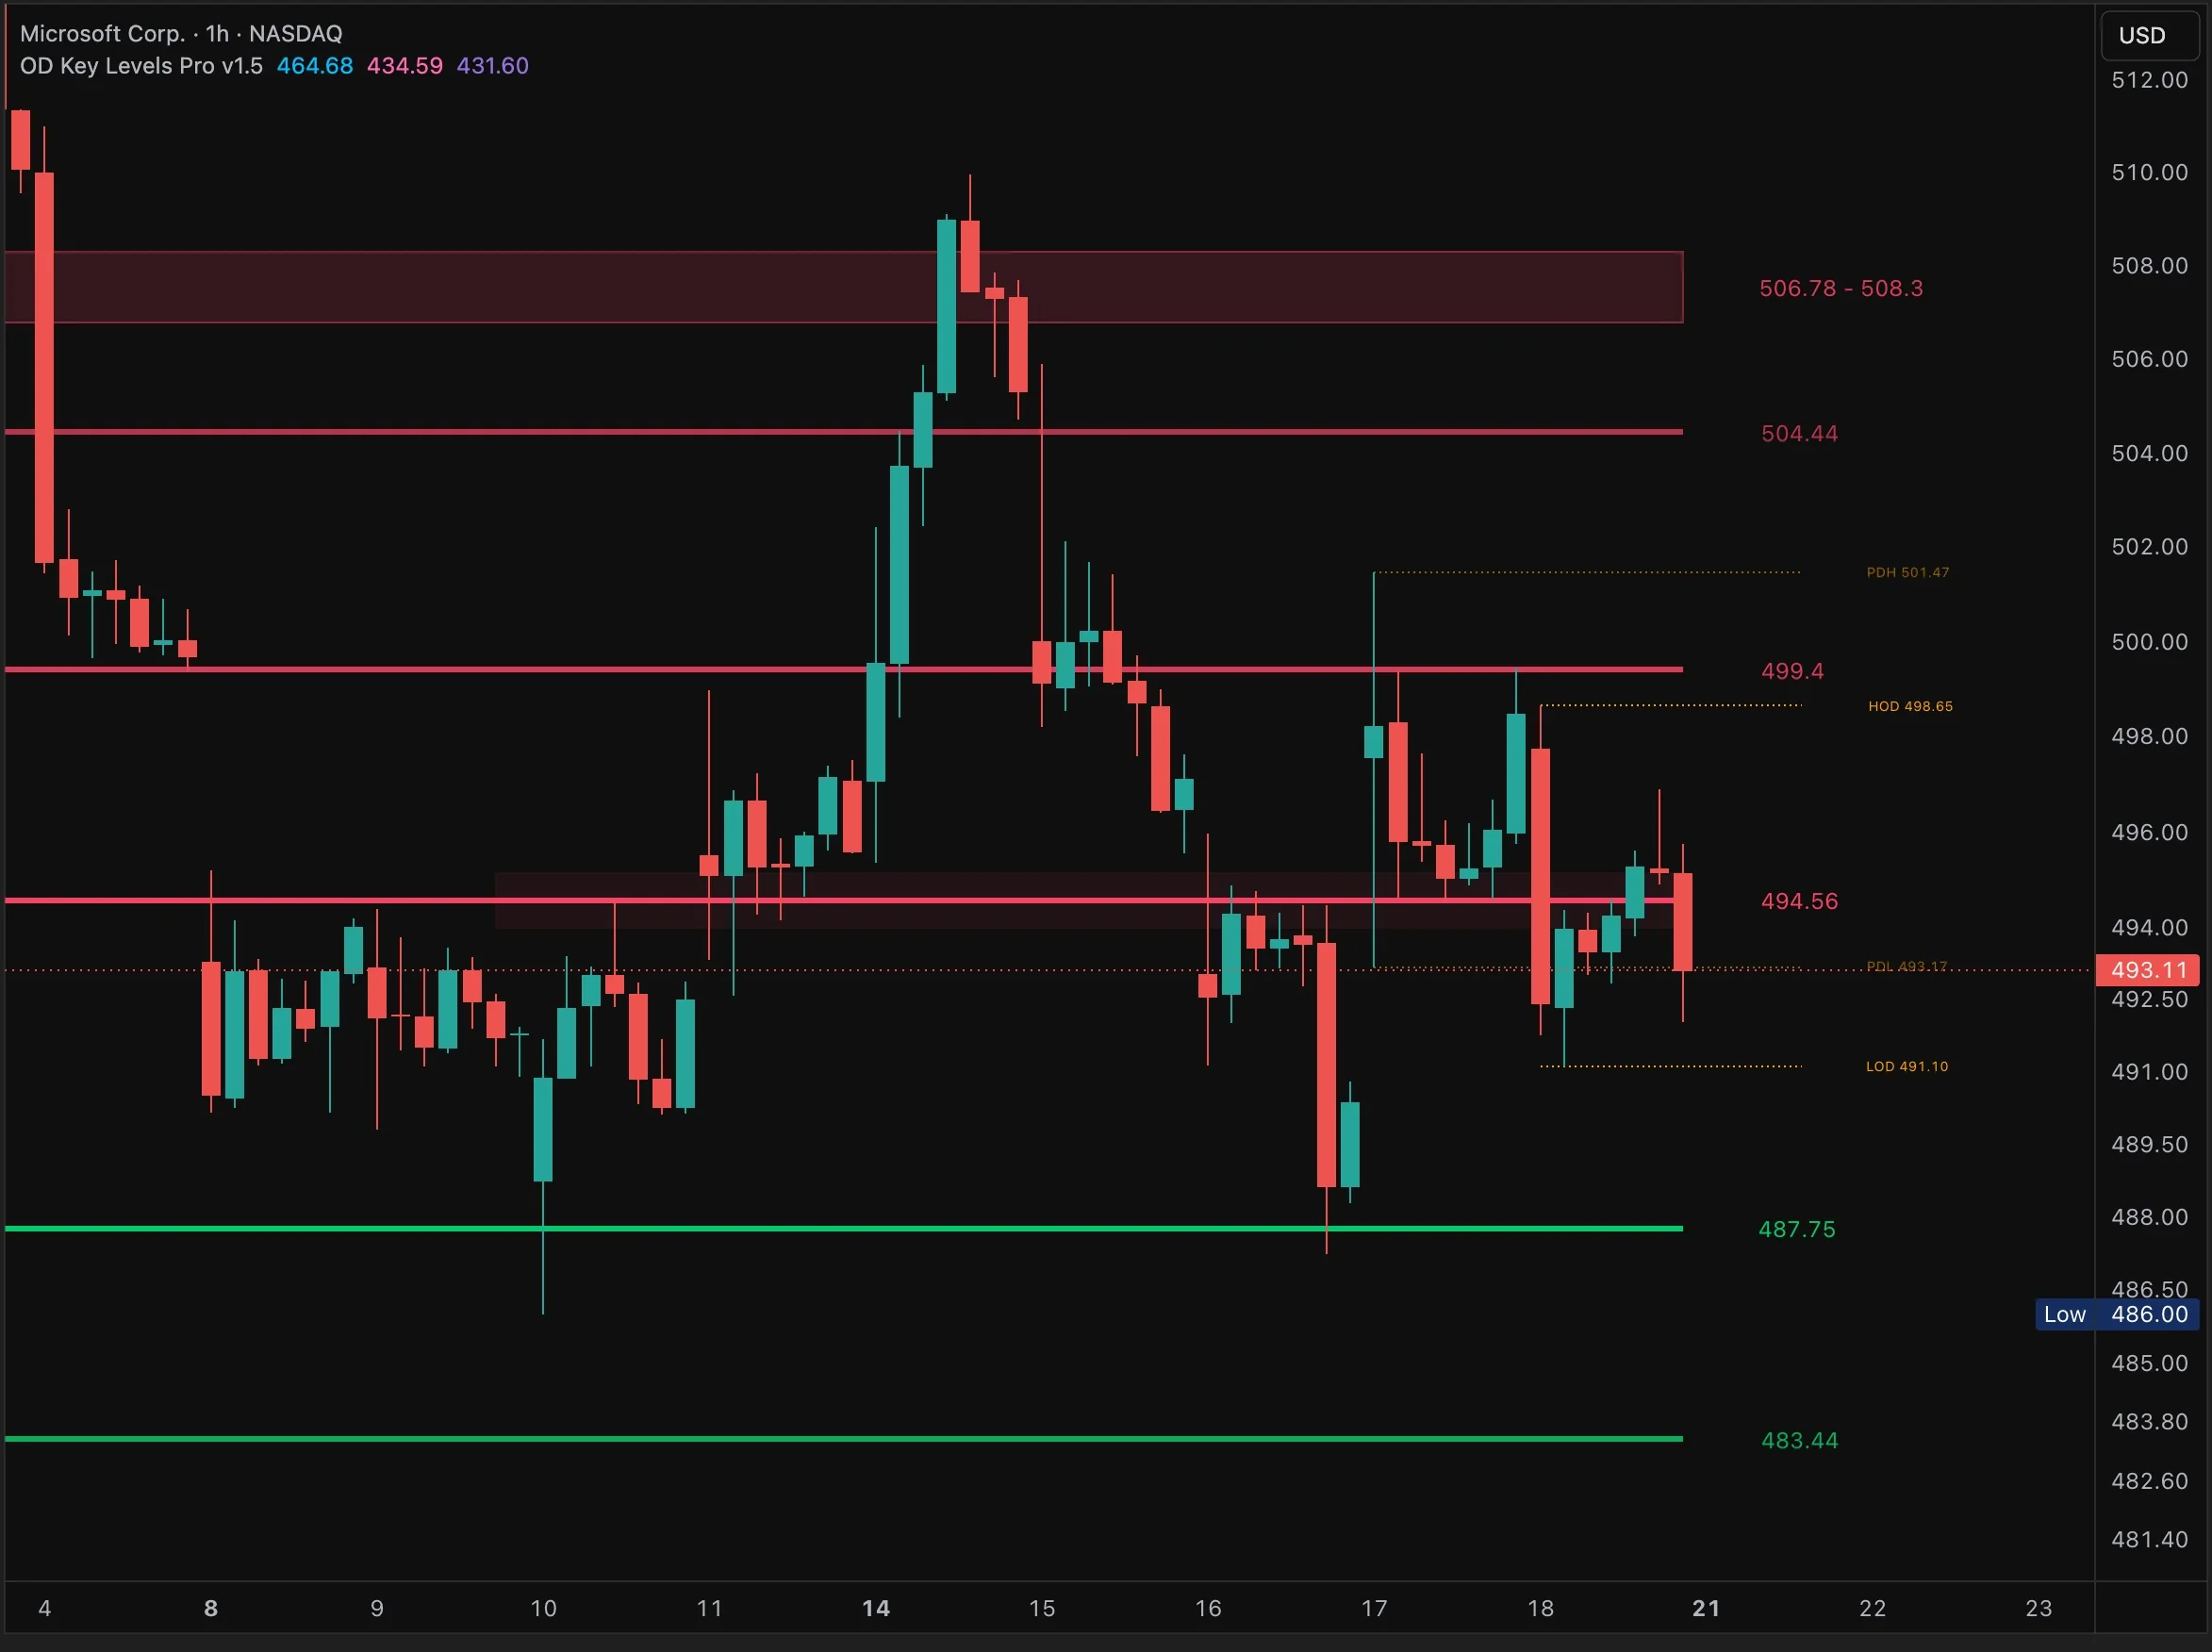
Levels tell you where.
Annotated example · Not live data
From plan to review
Prepared on TradingView
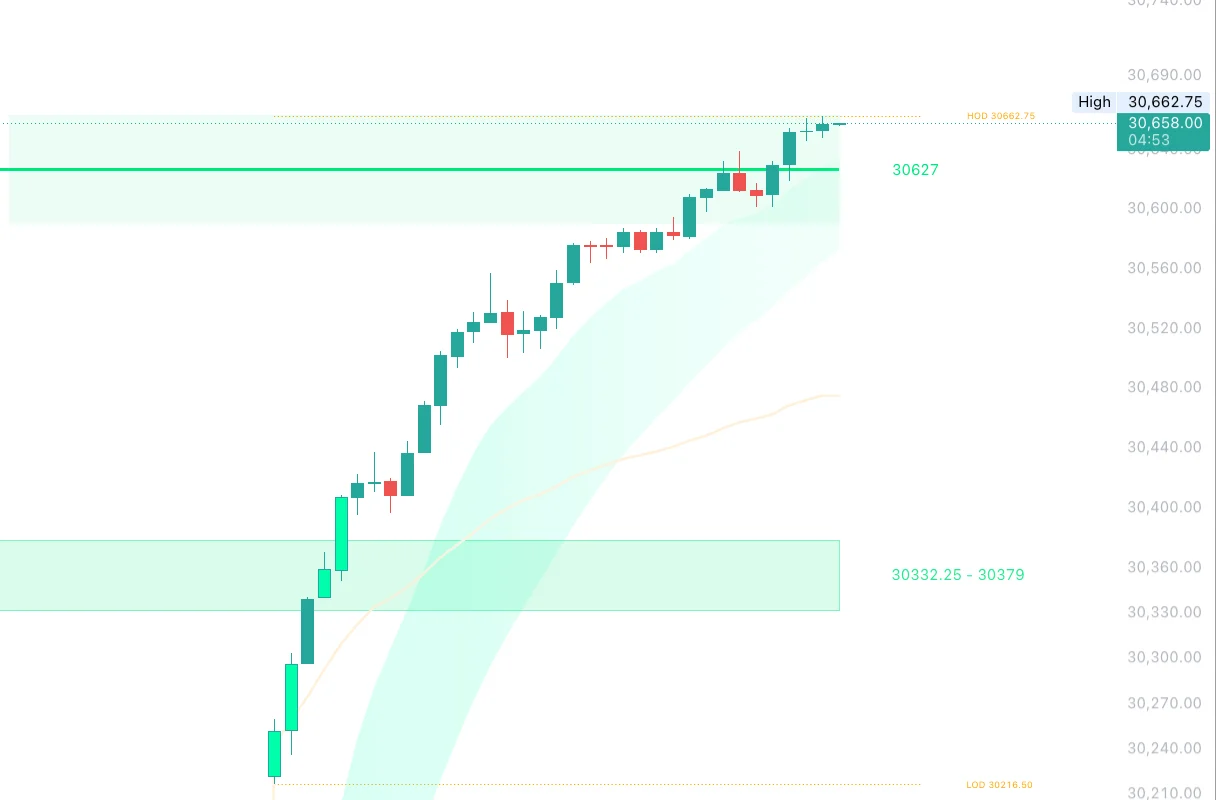
 Level 30,627VWAPZone 30,332 to 30,379Long 30,443.75
Logged in TradeDeck
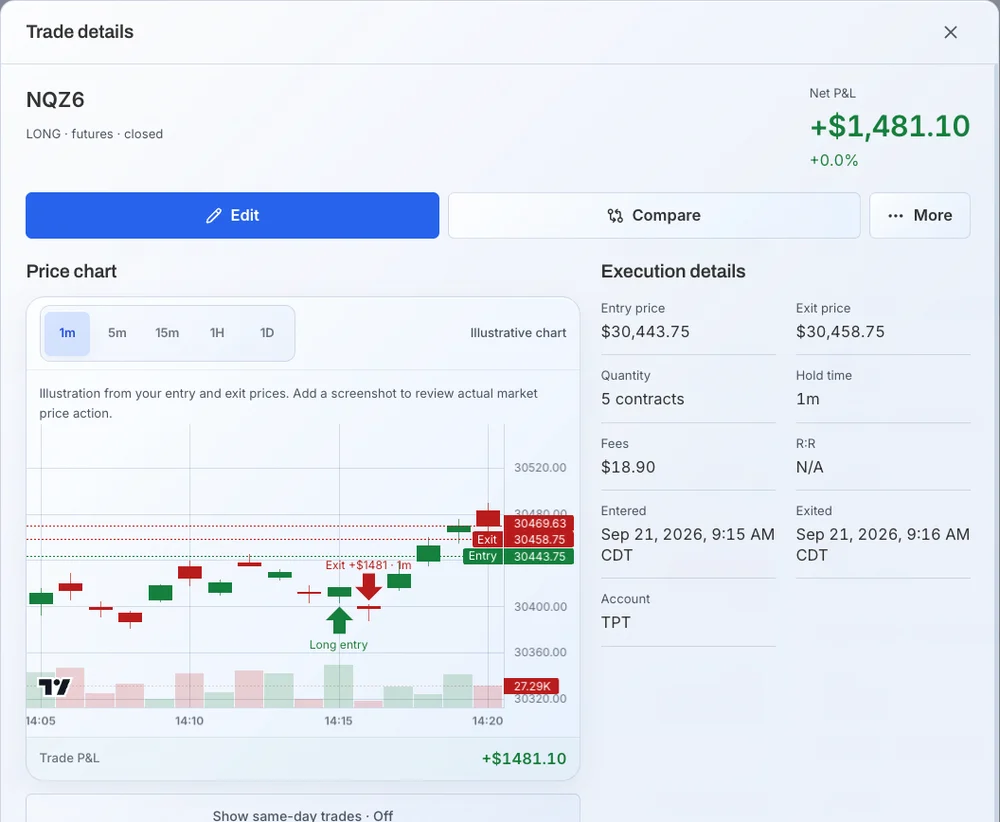
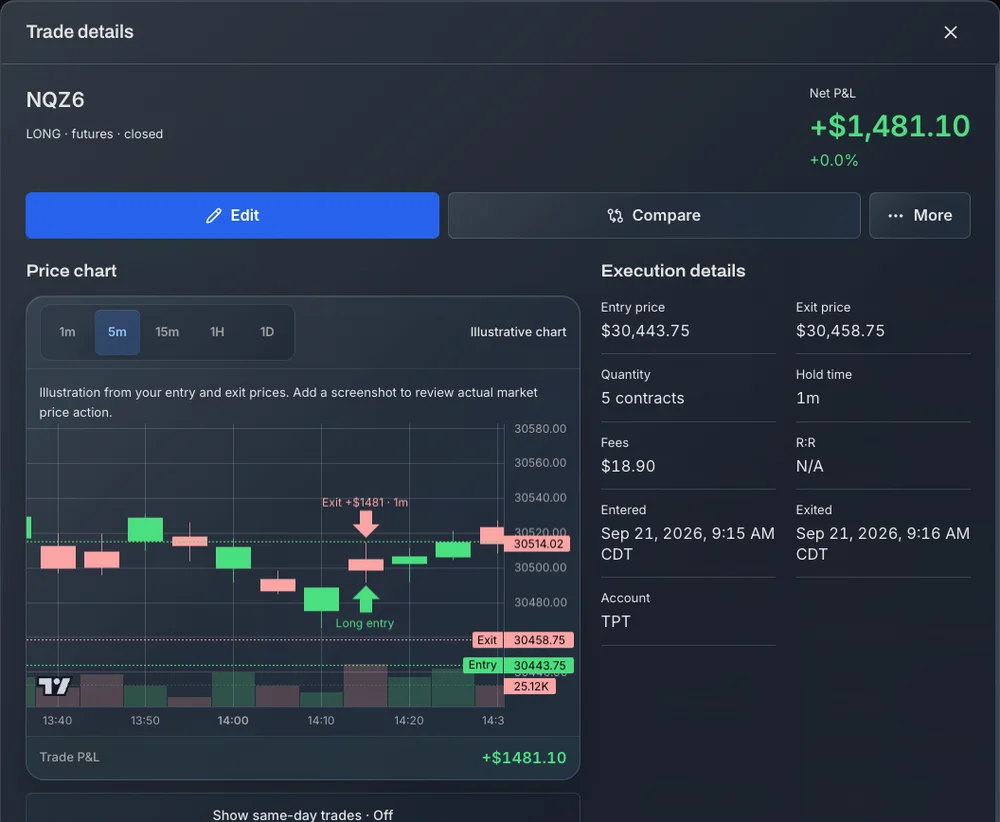
After the trade · Included
Win rate67%
Profit factor2.48
April 2026
+$1,365 · 15 trades
Sample data
Tue, Apr 7
+$302
NQ Short+$120
Opening range · 09:50 to 10:03 · Funded
“Took the planned target.”
QQQ Long+$182
VWAP reclaim · 10:05 to 12:20 · Main
“Waited for the reclaim. Exited before my planned target.”
Your watchlist, covered
Built on real levels
“Their levels are some of the most accurate I’ve used, and they keep adding new tools and features that actually help traders.”
55symbols with hand-picked levels
Hundredsof support and resistance levels
Weeklylevel updates
10built-in broker import formats
Everything included
7 days free
$30/month
after your 7-day trial · or $199/year
Nothing charged today. Cancel before the trial ends and you pay nothing.
FAQ
Free for 7 days, then $30/month · Cancel anytime
The monthly plan starts with 7 days free, with nothing charged today. The trial includes all three indicators and the full journal. After 7 days it continues at $30/month. Cancel before then, from Settings under Subscription, and you are not charged. The yearly plan ($199/year) has no trial.
Three indicators and the journal, one membership. Try it free for 7 days.
Educational tools only. Not financial advice or trade signals.
