

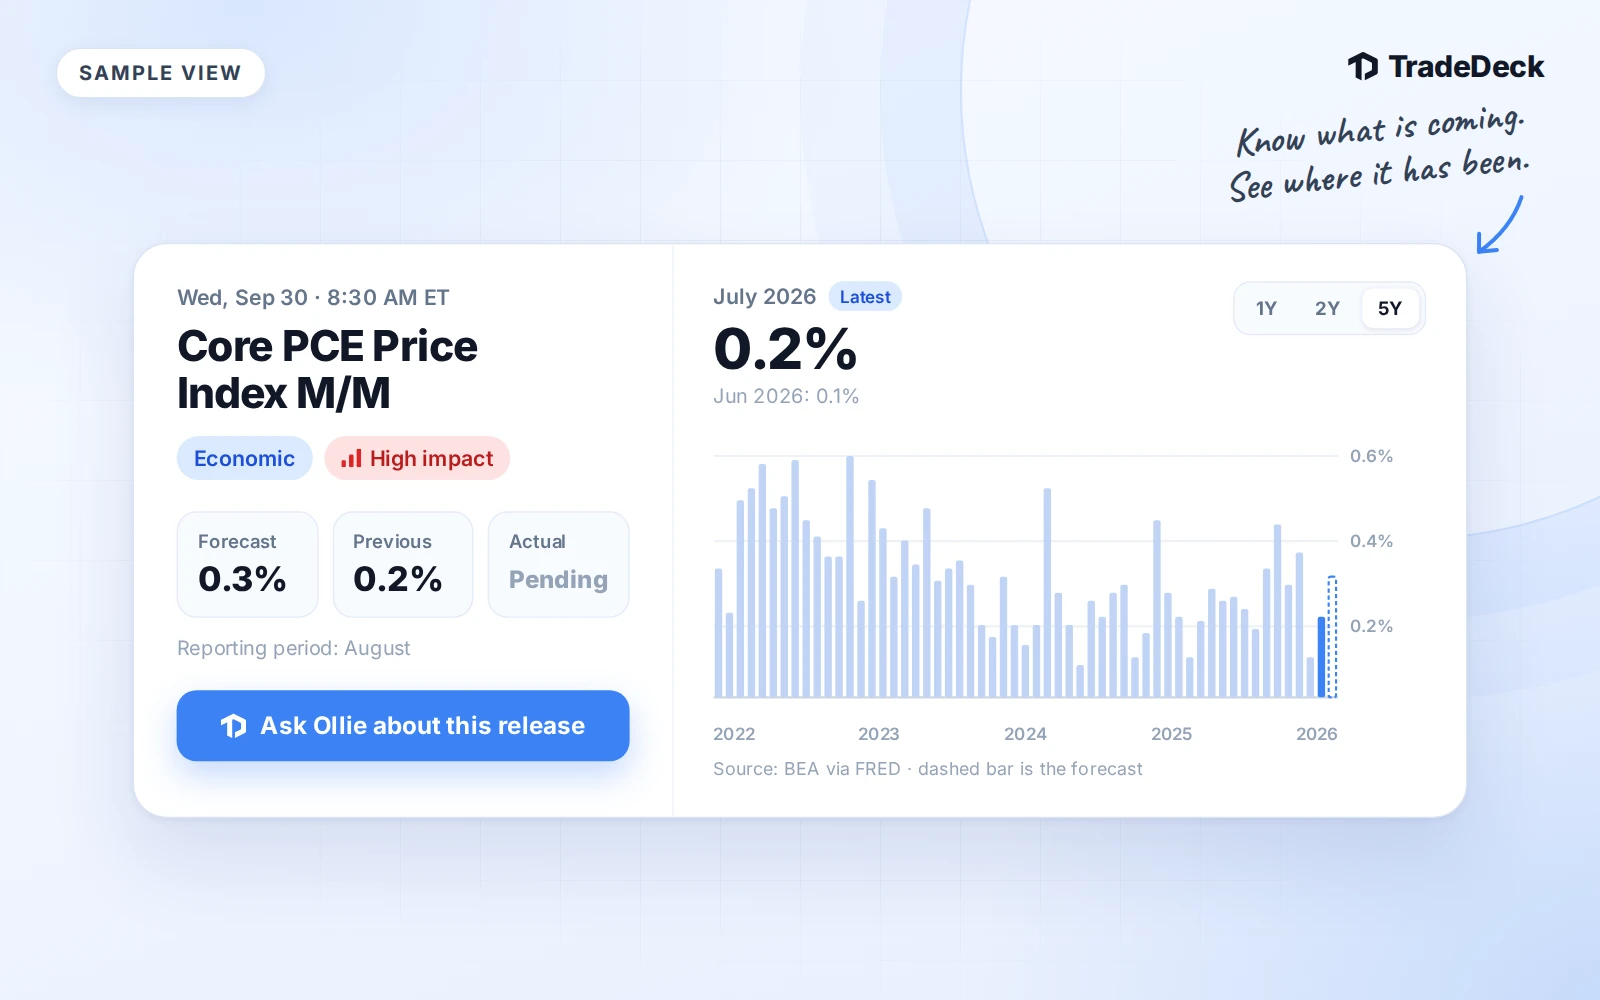
A forecast on its own does not tell you much. "Core PCE 0.3%" only means something next to the last few months: is that hotter than usual, a return to trend, or the third soft print in a row? Until now you had to open another site to find out. Now the answer is inside the release itself.
What changed
Open an economic release in the Market Calendar and, under the Forecast, Previous and Actual values, you now see that release's history.
- Up to five years of official values, with 1Y, 2Y and 5Y views
- The latest value highlighted, with the one before it for context
- The forecast for the upcoming release drawn in place as a dashed outline, so you can see where the consensus sits against the trend
- Drag across the chart, or use the arrow keys, to read any month
- A source line on every chart naming the agency and the month the data runs through
It works the same in the browser and in the TradeDeck iOS app, where each month you drag across gives a light tap.
Bars for changes, a line for levels
Numbers that measure a change are drawn as bars from zero: monthly and yearly inflation, payroll gains, GDP growth. You can see at a glance which months were hot, which were soft and which went negative.
Numbers that measure a level are drawn as a line on a fitted scale: the unemployment rate, job openings, weekly jobless claims. A rate that moves between 4.0% and 4.5% looks flat as bars that start at zero, and the line shows the turn that actually matters.
Which releases have history
The history covers the official U.S. releases traders watch most:
- Inflation: CPI and core CPI, the PCE and core PCE price indexes, and PPI final demand, each as a monthly and a 12-month change
- Jobs: nonfarm payrolls, private and manufacturing payrolls, the unemployment rate, U-6, participation, average hourly earnings, job openings and quits, and weekly jobless claims
- Growth and spending: GDP, retail sales, industrial production and capacity utilization, durable goods and core capital goods orders, factory orders, and business inventories
- Housing and trade: housing starts, building permits, new home sales, and the trade balance
When a release on this week's calendar matches one of these, its dialog shows the chart. Some widely watched numbers are licensed by the companies that publish them, including the ISM surveys, S&P Global PMIs, Conference Board confidence and Case-Shiller home prices. Those releases stay on the calendar with their forecast and previous values, without a history chart.
Where the numbers come from
Every value comes from the agency that publishes it, the Bureau of Labor Statistics, the Bureau of Economic Analysis, the Census Bureau, the Federal Reserve and the Department of Labor, through FRED at the Federal Reserve Bank of St. Louis. Before the data went into TradeDeck it was checked against the figures the agencies published.
Three details are worth knowing:
- The history uses the latest revised values. Agencies revise recent months, so a past bar can differ from the number first reported that morning. When the latest revision of last month no longer matches the Previous value on the calendar, the chart says so in one line.
- Months that were never published stay blank. October 2025 has no CPI or unemployment reading because of the federal government shutdown, and the chart shows the gap instead of filling it in.
- Each chart shows the month its data runs through, so you always know how current it is.
Ask Ollie about any release with history
Every release with a chart now has an Ask Ollie about this release button. Ollie, the assistant in your journal, reads the same history you see and can tell you how the coming number compares with recent months, how often the last year came in above or below a level, or what the trend has been since a turn. Ollie names the source and the month the data runs through, treats the forecast as the published consensus, and never recommends a trade or predicts what a release will print.
Ask Ollie is part of TradeDeck Pro. The Market Calendar and its history charts are included for every member.
Try it
Open the Market Calendar and tap any release with a history chart. The free weekly market calendar shows the week's earnings, economic releases and Fed speakers at a glance, and signing in opens every release with its history.
Economic data describes what has happened. It is context for your own plan, not a signal, and nothing in TradeDeck is investment advice.